DE and GB might see a flattening of new cases
Otherwise nothing much has changed
Brazil: Compared to before the weekend, daily infections fell to 22.7 per 100K but daily deaths rose to 0.643 per 100K. Both trendlines are pointing down. The map still shows São Paulo and Veracruz as the hardest hit. Things look not too bad and we shall see what the rest of the week will bring.
Outlook: Very Bad With Maybe Some Hope
U.S. minus CA,NY,WA: As predicted, daily infections increased, but only a little, to 13 per 100K but continuing the downward trend. Likewise, daily deaths increased to 0.402 , trending down as well. The daily positive rate dropped a little to 7.6% and the R-value was again below 1. The risk map shows Texas going red while the remaining states remained unchanged.
Outlook: Very Bad With Hope
California, the confused state. Daily infections fell to 11.7 per 100K, repeating a pattern from 2 weeks ago when numbers dropped in a similar pattern. The trend went flat. On the other hand, daily deaths rose by a lot to 0.253 and trending down. The daily positive rate rose to 6.8% and R-value remained above 1. The risk map showed coastal and central counties going for the better but the red counties remained red.
Outlook: Very Bad With Confusion
Washington showed a continuation of a great downward trend. Daily infections dropped to 3.4 per 100K with a continued downward trend. This looks like an outlier but of course I hope that it isn't. Daily deaths also dropped, to 0.053 per 100K and trending slightly down. The R-value remained at 1.11 and a Cascade county went better in the risk map, making the state look less red.
Outlook: Bad With Hope
New York continued its long-term trend down for new infections despite daily infections increasing to 2.1 per 100K, and daily death numbers increasing to 0.041 per 100K. The daily positive rate remained at a good 0.8% as did the R-value, which remained at 0.93. The risk map added two green counties, which is a good sign but they could be yellow again tomorrow.
Outlook: Satisfactory With Concern
United Kingdom: Britain's daily cases showed a post-weekend increase from 1.1 to 1.6 per 100K, trending still up. Likewise, daily deaths increased from 0.004 to 0.018. Daily positive rate and R-value were unchanged. Possibly, daily cases could go flat at about 2 per 100K, like Germany.
Outlook: Satisfactory With Concern
France: Daily cases remained largely at 3.3 per 100K, and still trending up. Daily deaths also remained almost the same, increasing to 0.018. The daily positive rate had been increasing for over a week to now 3%. The R-value, however, remained at 1.33. The risk map shows 3 Départements going worse and 1 going better, indicating a potential slowdown of the bad development. Likewise, 28 (+4) Départements were listed with elevated risk, as well as 273 clusters (+5). If things go fine this week, daily positives could go flat at around 3 per 100K.
Outlook: Satisfactory Getting Worse
Germany: Daily cases remained roughly at 1.8 per 100K. Daily deaths increased a little to 0.008. The R-value remained almost the same at 1.05 but the risk map had almost three times as many counties going for the worse than going for the better. Like in Great Britain, daily cases could go flat at a relatively high level of 2 per 100K, which would be dangerous but remain manageable.
Close to 40% of the new cases were imported, a number which should not be too alarming given the many test stations at airports and borders and the still relatively low number of asymptomatic people tested inside the country. Among those tested, the age group of 15-34 followed by those 5-14 showed the steepest increase, demonstrating the worrisome shift from the older to the young. With increased routine testing of asymptomatic people inside Germany (such as pupils returning to school) the percentage of young people among the positive will increase. Unfortunately, Germany is having issues getting tests done, which one should not expect from one of the wealthiest countries in the world.
Outlook: Satisfactory With Concern
Tunisia: Daily cases increased to to a record high of 1.1 per 100K. Most of these are local from the known hotspots but other regions also increased their counts. Daily deaths were 0.009 per 100K. The daily positive rate increased to 6.4%, which is not surprising given the high number of new cases. It is said that people visiting from the Gulf countries present fake Corona tests, which is likely given the corruption in the country. With a relatively young population, a lot of the infections will go undetected and will surface seemingly out of nowhere in any region. The country is preparing for tougher restrictions and it is worried about the beginning of the school year in mid September.
Outlook: Satisfactory and Getting Worse
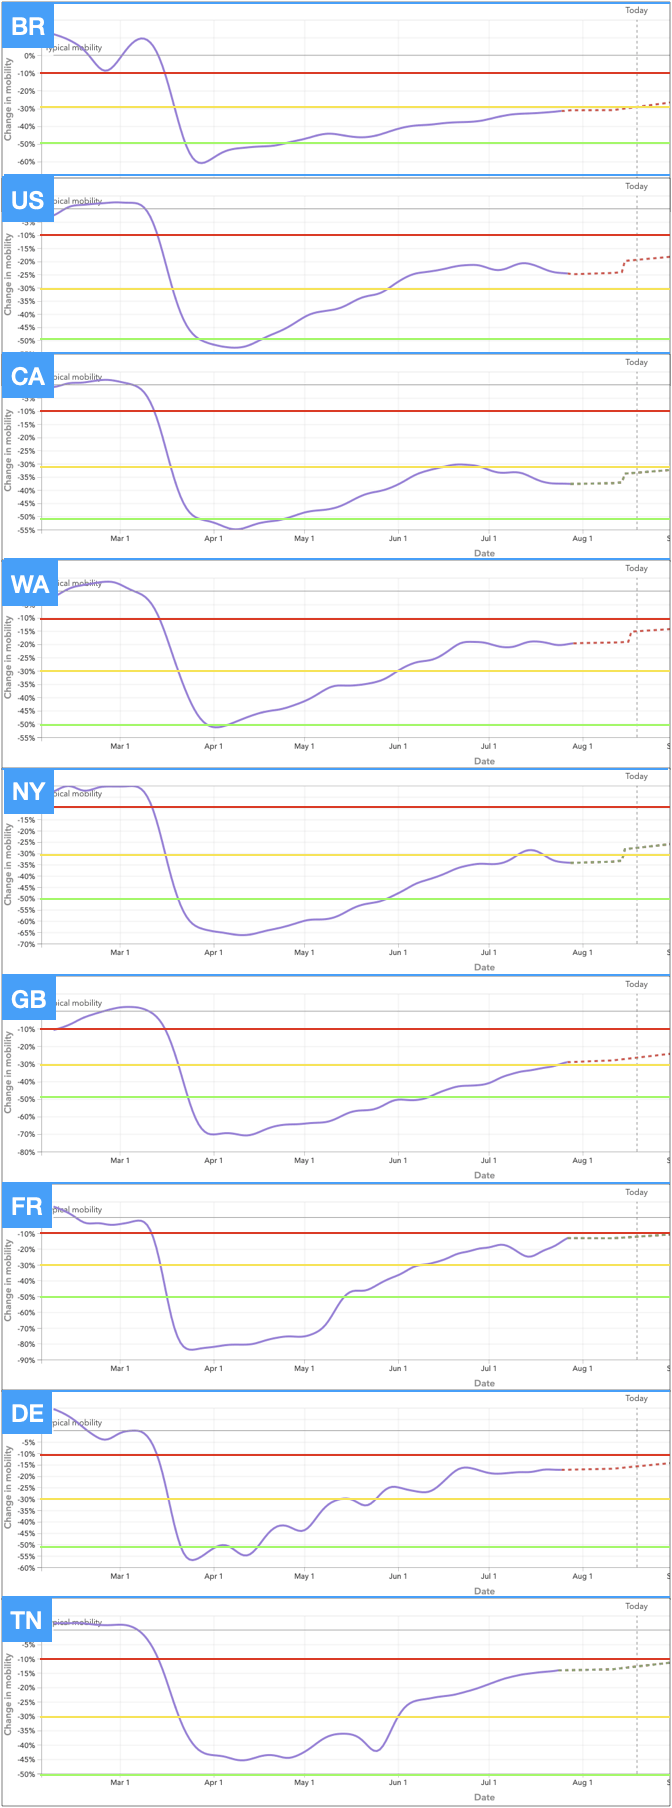
Reducing human contact (as measured by cell phone mobility data) can drive down infections so that mask use, testing, isolation, and contact tracing can work to contain the virus. I was curious how the countries and regions fared on distancing. The graphic below shows the degree of distancing from February until now.
New York, Britain and France restricted mobility the most during the worst of the pandemic, Germany not as much and in waves. California currently has the lowest mobility of all regions, followed by New York. On the other end of the spectrum, Germany, Tunisia and France currently allow most mobility.
Most importantly, it is impossible to correlate mobility with case or death numbers: Germany had relatively high mobility in June and July, as did Washington, yet the latter saw 10x more daily cases. Brazil currently has a lower mobility than the US, but they have 50% more daily infections.
It would be great to have a similar graphic for mask wearing, because I am sure it will correlate with case numbers.