Winter Peak Certain
With the cold season approaching in the northern hemisphere and the more proliferative delta variant dominant almost everywhere, and with vaccination progress projected (IHME) to not even reach 65% of full population vaccination until December in DE, FR, GB and WA (US: 55%, TN: 50%), it is almost certain that Corona numbers will remain high throughout this winter. If nothing changes, the maximum vaccination rate will be far from the proposed 85% for herd immunity.
We can singlehandedly blame the non-vaccinated for this disaster (see Remarks below).
Other not-so-good factors: the test-positive rates are above 10% in the US, Washington and Tunisia. This means that actual incidence is very likely to be a lot higher than what is officially reported. The discrepancy between reported and actual incidence numbers is particularly high in Tunisia but the US is following, thus moving further away from the characteristics of a rich, developed country.
| Daily Incidence | Daily Deaths | Daily ICU | Daily Pos. Rate | Average Excess Death | Death Projection | |
|---|---|---|---|---|---|---|
| USA | 44.2 ↗︎ | 0.297 ↑ | 6.5 ↗︎ | 15.1 % ↑ | 14.9 % | ↗︎↘︎ |
| WA State | 39.8 ↗︎ | 0.154 ↗︎ | 2.5 ↑ | 35.9 % ↑ | 08.5 % | ↗︎↘︎ |
| Britain | 45.9 ↗︎ | 0.145 ↗︎ | 1.3 → | 04.1 % ↗︎ | 14.3 % | ↗︎ |
| France | 34.7 → | 0.148 ↑ | 2.6 ↑ | 03.3 % ↘︎ | 14.1 % | ↗︎↘︎ |
| Germany | 07.5 ↑ | 0.019 → | 0.6 ↗︎ | 05.3 % ↑ | 06.5 % | ↑ |
| Tunisia | 19.0 ↘︎ | 0.928 ↘︎ | 22.4 % ↓ | 21.0 % | ↘︎ | |
| Spain | 27.4 ↘︎ | 0.162 ↗︎ | 2.1 | 09.2 % ↓ | 13.7 % | ↗︎→ |
At the beginning of the year the new vaccines gave us hope that the pandemic would be over by year's end. As spring was approaching and vaccination numbers were going up, we started to make plans for summer holidays unencumbered by restrictions. Today we see numbers explode again, some even setting new records. Continued or renewed restrictions for the remainder of the year are therefore certain.
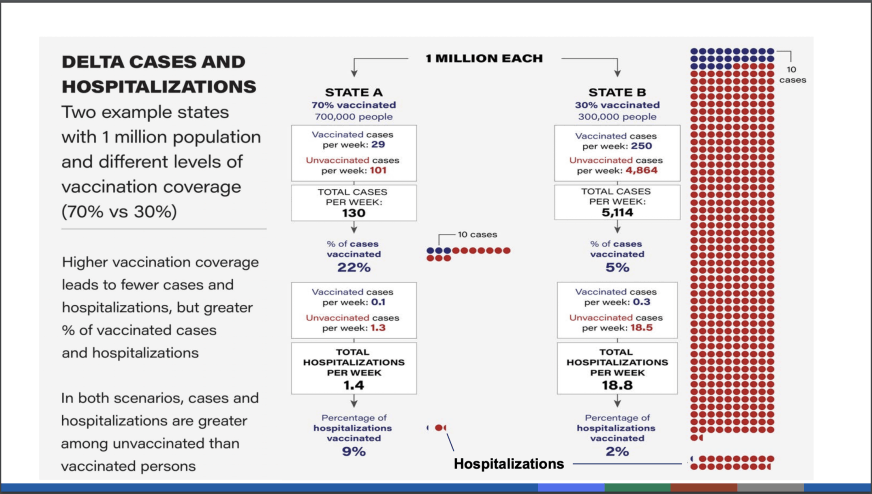
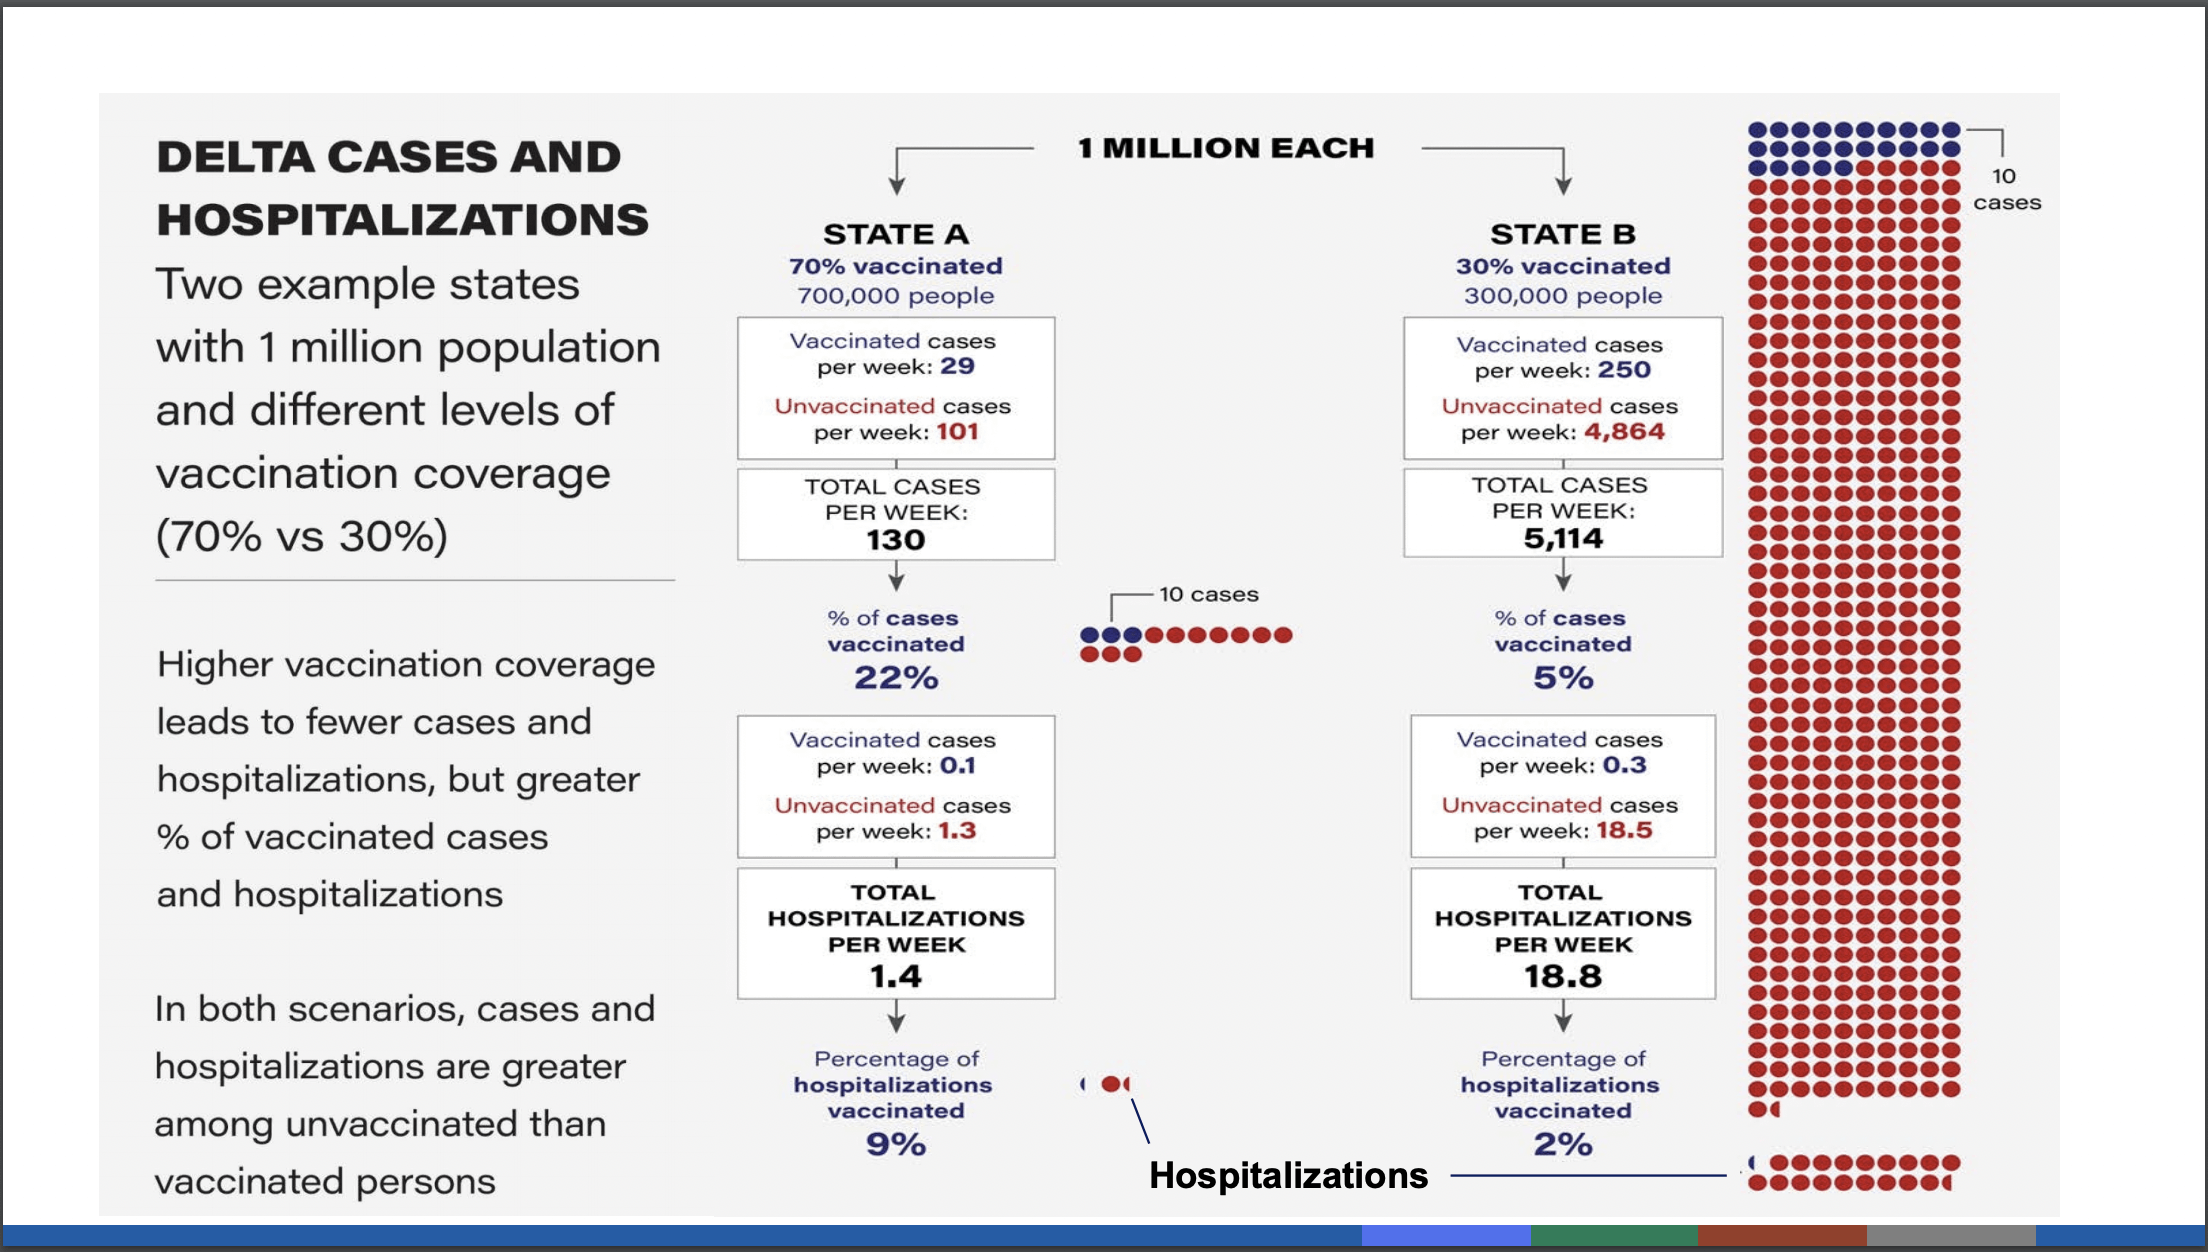
The US-American CDC just released a report (PDF) on these latest numbers and they demonstrate impressively what I alluded to in the title above. Below I am showing one of their figures, which compares two hypothetical states with a population of 1 million each but differing in the vaccination rate: State A has 70%, state B 30%. As a result, state B is graced with many more dots than state A, each one standing for 10 positive cases and almost all of them are red, meaning non-vaccinated individuals.
As a side remark: State A, while far fewer cases than state B, has a lot higher percentage of vaccinated people among its cases than state B. This is the side effect of having a highly vaccinated population and demonstrates that vaccination does not protect us completely from becoming infected. I estimate that in a fully vaccinated population, about 30% of the people will still get infected. This is testimony of the potency of the virus and of the continued need for vaccination over the next decades, if not the rest of our lives.
The CDC documents lists some other interesting facts and diagrams on various aspects of the virus and the pandemic, which are worth perusing.