Winter is looming and school has started. Any small change for the better is probably going to be wasted soon. France's (and Spain's and soon Britain's) development is of great concern.
As I said several weeks ago, the best way to respond to this crisis would have been a near-complete, short lockdown followed by rigorous testing, testing, testing and quarantining. Unfortunately, this only works in societies that have gone through pandemics in the recent past. The wavering we got instead hurt the economy more and we have not seen the end of it.
Brazil made up for the big drop over the weekend but remains on a good albeit slow trajectory downward. Daily infection numbers rose from 6.8 to 24.1 per 100K and daily deaths fell from 0.240 to 0.416. The incidence map had more cases in coastal states, notably in Rio de Janeiro and São Paulo and fewer inland.
Outlook: Very Bad With Hope
U.S. minus CA,NY,WA: The sharp drop over the weekend was made up by the new data. Daily infections more than doubled over the weekend, from 6.8 to 15 per 100K and so did daily deaths, which went from 0.081 to 0.333. The R-value was 1.04 and slightly up. Daily positive test rate rose from 6.3% to 6.5%. These increases, as high as they might seem, did not alter the trajectory of both curves, meaning slightly downward. The risk map looked the most positive ever with six states going for the better and none for the worse. But: New scientific analysis suggests that the number of infections could be significantly higher than reported. What that means is not clear but it cannot be good for a swift recovery.
Outlook: Very Bad With Hope
California was one of the states with better risk estimate. Daily infections rose a little from 7.2 to 8.4 per 100K and daily deaths doubled from 0.120 to 0.281, which is closer to the upper end of the very wide corridor the numbers have set in past months. But the trend remained downward, and steeply so for daily infections. The R-value went up to 0.94 and the good counties outperformed the bad counties on the risk map.
Outlook: Bad With Hope
Washington, after having reported no values for the 8th, is back, albeit with a so-so development. Daily infections increased from 5.2 to 7.1 per 100K, pushing the trendline almost to the horizontal. Whether or not this was a one-time event, Washington's daily infection numbers have never really hit a low and I fear that the state is unable to help itself and is waiting for the boost from the vaccine. Daily deaths rose to 0.079, which is a good value, if it could only remain there. The R-value increased from 1.02 to 1.04 and the the daily positive rate went from 2.9% to 3.3%, both being still OK. The risk map showed less red and more green but the most populous county, King, remains staunchly yellow.
Outlook: Bad With Hope
France: The first days of the week made daily infections jump from 9.8 to 14 per 100K and daily deaths from 0.057 to 0.060. One day earlier, this value was even 0.085 and there is a clear upward trend. This development is of great concern to the government and local lockdowns are being discussed. Likewise, the daily positive rate had been increasing for six weeks to 5.4%. The R-value, however, has fallen from 1.29 to 1.19, but that estimate is from six days ago and it does not match the increasing infection numbers. The risk map had 12 Départements going for the worse and none for the better.
Outlook: Very Bad Going Worse
New York: Daily infections increased from 2.2 to 4.5 per 100K, which is within the rather wide corridor these numbers have formed over the past two months. The same is true for the daily death numbers, which fell from 0.031 to 0.026. The risk map shows more counties going for the better than for the worse but NYC remains yellow.
Outlook: Satisfactory With Concern
United Kingdom: While the island is desperately setting sail to get away from the Continent, it is imitating the bad example set by Spain and France. Daily infections rose from 3.6 to 5.2 per 100K, which is a 4-month high (the first peak was at 8 per 100K). While this looks bad, we need to remind ourselves that this second peak in associated with almost no real rise in the death toll. Thus, daily death numbers dropped sharply from 0.047 to 0.009, making the previous high value a clear outlier. Consistent with the rise in daily infections, the R-value, which has been very constant over weeks, went up to slightly above 1 and daily positive tests edged up by a notch as well.
Outlook: Satisfactory With Concern
Germany: Daily infections rose from 1.4 to 2 per 100K with more districts going for the worse than going for the better. Some districts with large cities went orange or even red, particularly in the South. Bavaria is still hardest hit and going worse. Also, the R-value rose above 1 (at 1.11). The daily death numbers fell from a low 0.011 to an even lower 0.006, the only warm beacon in the grey outlook. Germans fear Trump more than Coronavirus. Well, maybe they should fear Coronavirus a little more.
Outlook: Satisfactory Going Worse
Tunisia is a few days behind with data reporting (the 8th to be correct). On the 7th it has seen the highest recorded value in daily infections. From before the weekend, they increased from 2.5 to 3.3 per 100K and daily deaths from 0.017 to 0.034, representing four fatalities. This may seem little but compared to earlier streaks of no deaths for weeks, this number is concerning. The daily positive rate jumped from 9.1% to a hurtful 10.5% (and off the chart), which is testimony to the country's inability of getting enough testing done. All of the 101 fatalities to date have been of old age and most died in hospitals, the capacity of which remains sufficient to accommodate more. This is in spite of the continuing problem of doctors leaving Tunisia (in 2019 it was 400).
Outlook: Satisfactory Going Worse
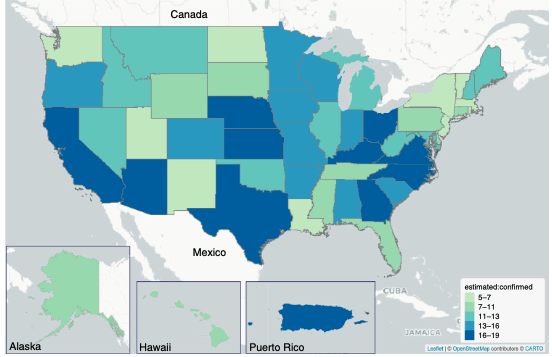
Scientists from Berkeley did a semi-Bayesian probabilistic bias analysis and came to the conclusion that the U.S. has severely underestimated the number of infected people. According to their calculations, there should be about 9x more. Undercounts are distributed very unevenly, as seen in Figure 3b of their publication (below).
The authors conclude that their results contribute to a growing consensus that a very small proportion of the population has developed immunity and that the U.S. is not close to achieving herd immunity.
This is nothing really new though but it is another piece in the mosaic that is Coronavirus.
And it probably should dampen the hope for a swift turnaround in the U.S.