Time for introspection in the West (meaning: stay home), normal life with caution in the East
Maybe I should emigrate to New Zealand
Tunisia is closing the daily death gap to Brazil. The difference is that Tunisia's death toll trends to an increase where Brazil's is on the decline.
In the U.S., Trump's foes usually cite absolute numbers to make the spread look worse than it actually is compared to other countries. Looking at the table below, it is clear that they are wrong for the daily infections (also referred to as incidence and, falsely so, as cases) where the U.S. trail France and Britain by a big margin. In their zeal to make Trump look bad, they forget the more important number, that of the daily deaths, where the U.S. is clearly one of the leading nations in the world, only eclipsed by Brazil and Tunisia (in my list, of course). Mexico, Peru, Spain, the often overlooked Belgium, Chile, Bolivia and others report more deaths per capita than the U.S. If Trump were as smart as he claims to be, he would cite the aforementioned list and say: see, we are doing better than our former Banana Republics.
Of the three U.S. States in my list, only New York has a good outlook for the winter although California's numbers look good for now. Washington State's risk went from yellow to orange, reflecting the same change in its most populous county (King, with Seattle metropolitan region). The conservative U.S. states have almost all shifted to the highest risk but the liberal states are catching up: Washington, Massachusetts, Rhode Island and Connecticut have gone orange.
France and Britain have vertiginous incidence numbers and their daily deaths, while lower than in the U.S., have, locally, already crossed the border into dangerous territory (such as in Manchester and Marseille). Britain's deaths, however, are predicted to rise only mildly during winter whereas French deaths are predicted to have a strong peak at the turn of the year and then to decline.
Germany, on the other hand reports slower increases than France and Britain, but death numbers are rising steadily and it is just a matter of time before here too, the first ICUs will be saturated.
Sweden's daily deaths remain low and they are expected to rise just a little in the winter. But given the extremely low testing rate, it would not come as a surprise if the death rate were to spite the forecast.
China, standing for the Pacific-East, has almost no new infections and the death rate is predicted to increase only very mildly in the winter.
| Daily Infections | Daily Deaths | Daily Positve Rate | R | Prediction | |
|---|---|---|---|---|---|
| Brazil | 10.9 ↘︎ | 0.261 ↘︎ | 50.0% | ↘︎ | |
| US minus 3 | 20.1 ↑ | 0.243 → | 04.9% ↗︎ | 1.09 ↗︎ | ↑ |
| California | 07.8 → | 0.149 ↘︎ | 02.5% ↘︎ | 0.96 ↘︎ | ↑ |
| Washington | 08.7 ↗︎ | 0.096 ↗︎ | 03.2% ↑ | 0.97 ↗︎ | ↑ |
| New York | 07.2 → | 0.054 ↗︎ | 01.2% → | 1.01 → | → |
| France | 37.1 ↑ | 0.203 ↑ | 13.6% ↑ | 1.37 ↗︎ | ↑ |
| Britain | 26.9 ↑ | 0.200 ↑ | 06.5% → | 1.4 → | ↗︎ |
| Tunisia | 11.2 ↗︎ | 0.250 ↑ | 50.2% ↗︎ | ↑ | |
| Sweden | 08.1 ↗︎ | 0.033 → | 03.2% ↗︎ | ↗︎ | |
| Germany | 07.9 ↑ | 0.034 ↑ | 02.1% ↗︎ | 1.30 ↗︎ | ↑ |
| China | 00.0 → | 0.000 → | ↗︎ |
There has been plenty of speculation about the setting of infection (the locations or situations where people catch the virus). In the beginning, not knowing much, there was anguish about whether public transportation would be safe, planes, work places, agricultural work, day cares or retirement homes. We know know essentially as much as before, namely that it is the distance that counts most. And where distance is not possible, it is mask wearing to protect others from you.
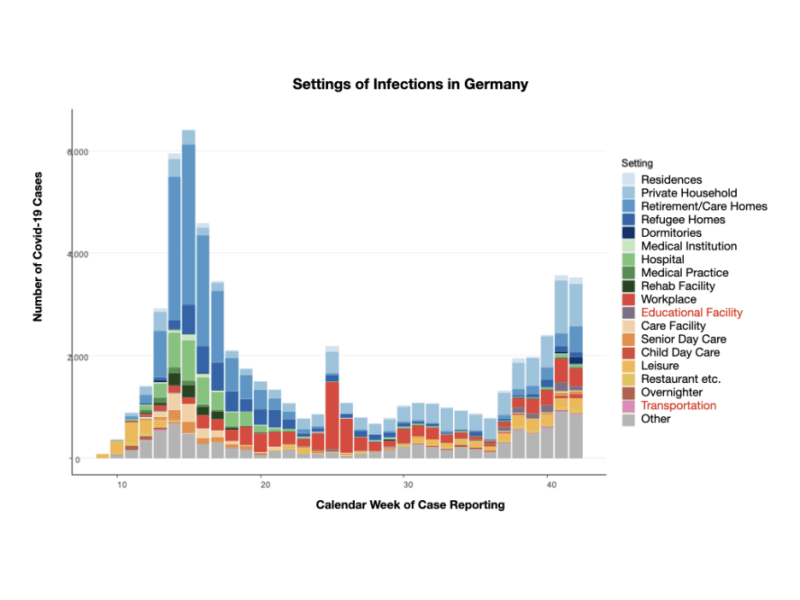
Statistical data are scarce and where the setting is being recorded, data are incomplete. Such is the case in Germany where the Robert Koch Institute (RKI) has published data that hints at a certain prevalence of infection settings (see figure below):
Reported infections in educational facilities (schools and universities) and transportation (bus, train and plane) are low whereas infections at home, in retirement homes and in day care are higher. The graph also shows the setting of a quarter of the latest data as "other," which hints at a plethora of other settings that the local health authorities can choose from and which makes the data even more obscure.
The only take-home message would probably be that buses and trains in Germany seem to be relatively safe.