The situation looks bleak but there are glimmers of hope.
And things will look a lot better in spring.
I have made a few changes: The colours on the graphs are now consistently blue for infections and red for deaths. The 7-day running average of the daily numbers is now fatter, which is helpful in places with a high day-to-day variability, such as for France. Furthermore, instead of writing about every country/state, I include a summary table listing the four parameters and, a new addition, the IHME prediction for the daily death numbers in the coming three months.
My assessment of the last three days: California is the only region with a clear downward trend in all four parameters. But their death numbers could be rising again in December. Next in line is Brazil, whose numbers have been declining for two months, but at a snail's pace. France and Tunisia show signs of a flattening of the current peak. In all other regions, infection numbers are still growing. While the US, France, Britain and Germany have reported localised shortages of ICU beds, Tunisia's entire health infrastructure is near saturation.
Wise men say that looking at the infection rate alone might be misleading and one should also include the number of ill-at-home and hospitalised people. I agree because the infections include a large number of asymptomatic cases or those with only mild symptoms. And while they can pass on the virus, they will not be a burden on the health care system. I will try to see if I can find reliable data sources. Past experience has shown that hospital data have an extremely high day-to-day variation and that reporting is even spottier than for deaths. But they could provide at least a tendency.
| Daily Infections | Daily Deaths | Daily Positve Rate | R | Prediction for Dec - Jan - Feb | |
|---|---|---|---|---|---|
| Brazil | 11.0 ↘︎ | 0.289 ↘︎ | 50.0% | ↘︎↘︎↘︎ | |
| US minus 3 | 15.6 ↑ | 0.228 ↑ | 05.3% ↑ | 1.06 ↗︎ | ↗︎↗︎→ |
| California | 07.7 ↓ | 0.160 ↘︎ | 02.6% ↓ | 0.90 ↓ | ↗︎↗︎↘︎ |
| Washington | 07.1 ↑ | 0.096 → | 02.9% ↓ | 1.05 ↗︎ | ↗︎↗︎→ |
| New York | 07.4 ↑ | 0.047 ↗︎ | 01.2% → | 1.13 ↗︎ | →→↗︎ |
| France | 21.8 ↑ | 0.101 ↑ | 10.4% ↑ | 1.07 ↑ | ↑↘︎↘︎ |
| Britain | 24.3 ↑ | 0.100 ↑ | 06.4% ↑ | 1.35 ↓ | ↗︎→↘︎ |
| Tunisia | 08.8 ↗︎ | 0.171 ↑ | 31.0% ↑ | ↑↘︎↘︎ | |
| Sweden | 05.6 ↗︎ | 0.011 ↘︎ | 02.2% → | ↗︎↗︎→ | |
| Germany | 03.9 ↑ | 0.013 ↗︎ | 01.3% → | 1.37 ↑ | ↗︎↗︎↗︎ |
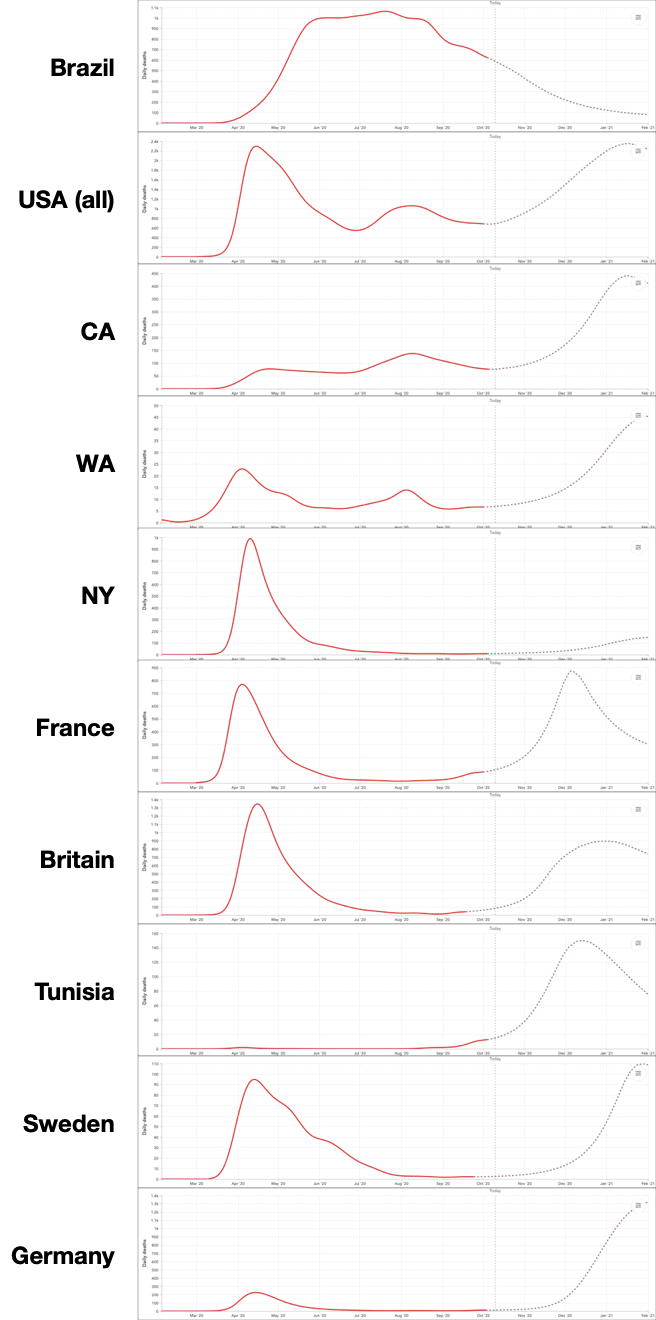
The predictions of daily deaths for December, January and February are interesting in so far as some countries or states could be doing better than thought. This is particularly true for New York. Brazil being an equatorial country does fulfil the expectations by continuing the current slow decline. Germany's daily deaths, on the other hand, are predicted to go far higher than in April.
Statistics by IHME on 9 October.
Revisiting these data on 2022-09-08, I must state that these predictions were eerily accurate.